Site-collection administrator
Follow these steps, or ask your admin, to enable the developer dashboard in on demand mode:
(green-can use your own values, red-controls outcome, black-don't change it)
1. Open the SharePoint Management Shell as an admin
2. Type the
following commands:
$service=[Microsoft.SharePoint.Administration.SPWebService]::ContentService
$devdashsetting=$service.DeveloperDashboardSettings
$devdashsetting.DisplayLevel=[Microsoft.SharePoint.Administration.SPDeveloperDashboardLevel]::OnDemand
$devdashsetting.Update()
This script
enables the Developer Dashboard in OnDemand mode.
You could also, as an alternative way of enabling this, add those commands to a text file, save the file as a .ps1 and then execute the ps1 on your farm.
You could also, as an alternative way of enabling this, add those commands to a text file, save the file as a .ps1 and then execute the ps1 on your farm.

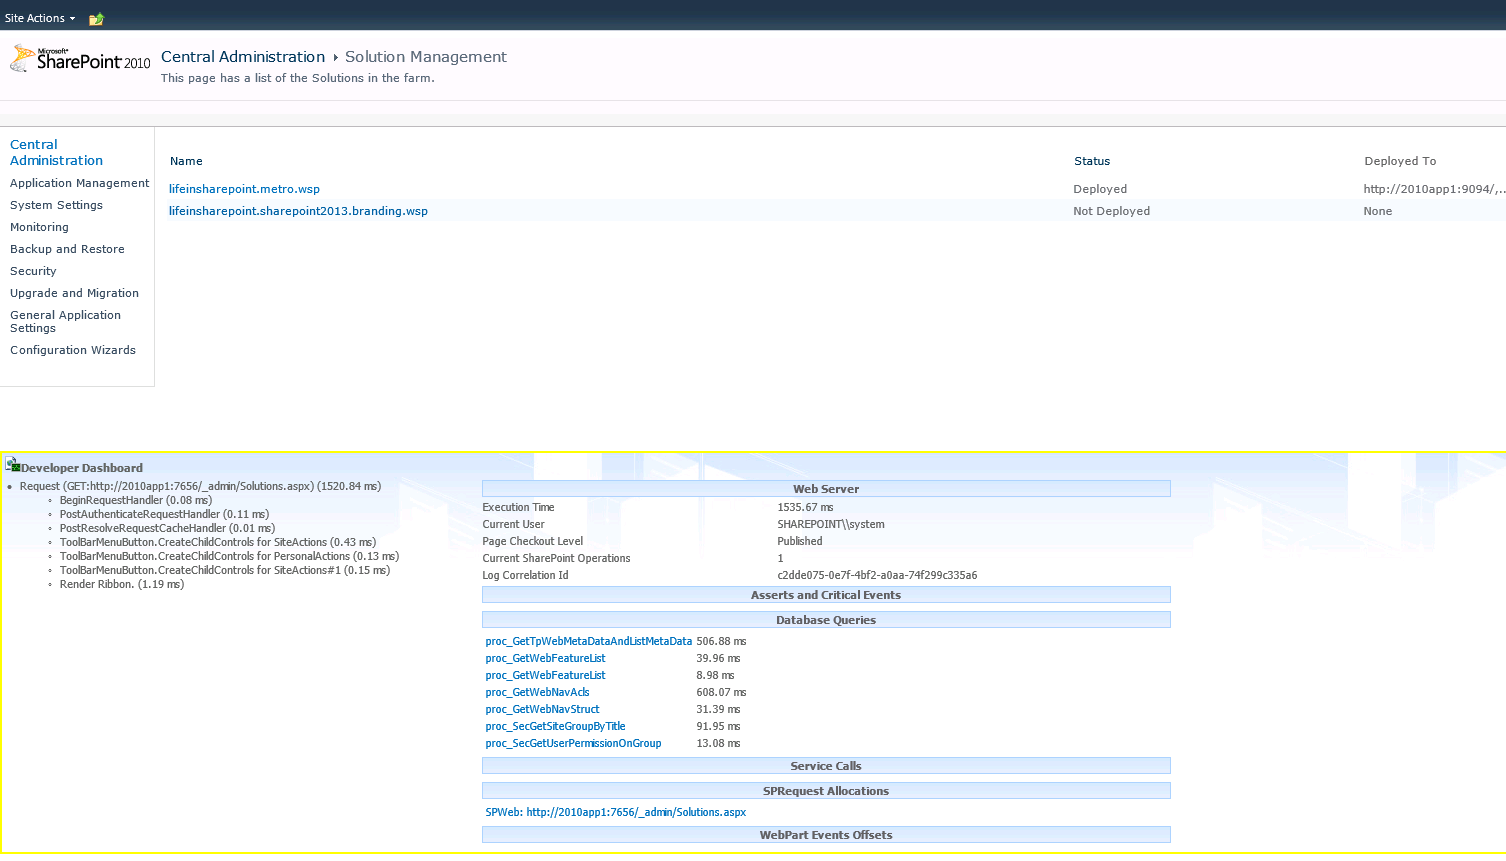
After the dashboard is enabled, the metrics are shown at the bottom of the page that is loaded, refresh the page to see how fast it loads, HTTP Handler events for the HTTP request, Web Server Stats, Asserts and Critical Events, Database Queries, Service Calls, SPRequest Allocations, and WebPart Events Offsets.
To turn it off
$service=[Microsoft.SharePoint.Administration.SPWebService]::ContentService
$devdashsetting=$service.DeveloperDashboardSettings
$devdashsetting.DisplayLevel=[Microsoft.SharePoint.Administration.SPDeveloperDashboardLevel]::Off
$devdashsetting.Update()


No comments:
Post a Comment
Thanks for commenting, if you have a question and want a reply, please post it on TechNet forums and reference this blog, or navigate to www.SharePointPapa.com and post it there, all of these blog posts and more are on my SharePoint Papa site.